Authors: Chaozhong Zou, PhD, ATCC Cell Systems; Luis Romero, MS, ATCC Cell Systems; Elizabeth Turner, PhD, ATCC Cell Systems; Brian A. Shapiro, PhD, ATCC; Penney McWilliams-Koeppen, MS, ATCC Cell Systems; and Brian Chase, MS, ATCC
Solute carrier kidney transporter (SLC) protein models are essential for determining the renal clearance of drugs, environmental compounds, and endogenous molecules. However, to date there is a lack of preclinical cell-based models; many current models do not express critical SLC proteins and those that do are not of mature adult kidney tissue origin. We created three different hTERT-immortalized human primary renal proximal tubule epithelial cells (RPTEC) that stably express the OAT1, OCT2, and OAT3 proteins. We then tested the ability of these cells to intracellularly convey known SLC protein substrates.
Introduction
Materials and Methods
Results
Summary and Conclusions
References
Introduction
The disposition and clearance of drugs by the kidney relies largely on a well-characterized subset of membrane transport pumps that are collectively known as solute carrier or SLC proteins.1,3 SLC transporters are membrane proteins that use a variety of energy-coupling mechanisms to transport solutes, such as ions, metabolites, peptides, and drugs, across biological membranes. Among the SLC family proteins, OAT1 (SLC22A6), OCT2 (SLC22A2), and OAT3 (SLC22A8) are the most important transporters in kidney tissue. Because the activity of these pumps is often the limiting factor for solute clearance from the kidney, they are recommended by both the US Food and Drug Administration (FDA) and the European Medicines Agency (EMA) as targets for drug-drug interaction studies.1 There is therefore a need for kidney toxicity models, especially in vitro models, that have human kidney origination, functioning transporters, accurate clinical predictability, and consistent data output for initial drug interaction studies.
Unfortunately, primary renal epithelial cells lose OAT1, OCT2, and OAT3 transporter expression quickly once placed in culture. Transiently expressing these transporters in primary renal epithelial cells yields large variations between production lots, making the data from those experiments hard to interpret. In addition to the transiently expressed SLC protein models, there are cell line-based models of kidney transporter function such as MDCK, CHO, and U2OS. Due to the fact that they may not have human kidney tissue origination or are themselves cancer lines, these models may significantly compromise clinical predictability. During the course of this project we generated kidney transporter cell models using well-characterized hTERT-immortalized RPTEC2 (RPTEC/TERT1, ATCC CRL-4031) that stably overexpress the OAT1, OCT2, or OAT3 gene. After confirming the SLC mRNA expression of each gene by RT-PCR, we performed immunostaining to confirm that OAT1, OCT2, and OAT3 are correctly trafficked to the plasma membrane. Notably, those clones show typical epithelial morphology and express the appropriate epithelial markers. Most importantly, we have verified that the overexpressed transporters have normal transport activities using 6-CF (6-carboxyfluorescein) or EAM-1 (N,N,N-Trimethyl-2[(7-nitro-1,2,3- benzoxadiazol-4-yl)amino] ethanaminium iodide) uptake assays. Furthermore, uptake of these compounds can be inhibited in a dose-dependent manner by well-known SLC inhibitors, indicating that the overexpressed kidney transporters are functioning as expected. Overall, our data demonstrate that these modified renal epithelial cell lines maintain kidney transporter expression over time, are useful tools that provide physiologically relevant data regarding human kidney function, and are more consistent and reliable than comparable in vitro models currently used in clinical trials determining the effect of exogenous compounds on renal membrane transporter function.
Download a PDF of this application note
Download NowMaterials and methods
RPTEC/TERT1 (ATCC CRL-4031) were transfected with a plasmid expressing the full-length sequence of human OAT1, OCT2, or OAT3. The genetically modified cells were grown under antibiotic selection and individual positive clones were identified and verified by RT-PCR, immunofluorescence, and Sanger sequencing (Figure 1). The parental line was used as a control. A single clone, positive for each SLC transporter, was selected for further validation based upon optimal results from the assays. Cell culture medium consisted of DMEM: F-12 Medium (ATCC 30-2006) supplemented with hTERT Immortalized RPTEC Growth Kit (ATCC ACS-4007). OAT1, OCT2, and OAT3 transfectants were seeded onto poly-L-ornithine-coated chamber slides and cultured at 37°C, 5% CO2. After 24 hours, the OAT1-expressing cells were fixed and stained with a mouse monoclonal antibody against OAT1 (Abcam) and a goat anti-mouse 596 secondary antibody then visualized with a fluorescent microscope. The fixed OCT2-expressing cells were stained with a rabbit polyclonal antibody against OCT2 (Millipore) and a goat anti-rabbit 488 secondary antibody. The fixed OAT3-expressing cells were stained with a rabbit polyclonal antibody against OAT3 (GeneTex) and a goat anti-rabbit 488 secondary antibody. Cell micrographs were acquired using an Eclipse Ti inverted microscope (Nikon) and a Zyla sCMOS camera (Andor). Sanger sequencing confirmed that the resulting RPTEC/TERT1-OAT1 (ATCC CRL-4031-OAT1), RPTEC/TERT1-OCT2 (ATCC CRL-4031-OCT2), and RPTEC/TERT1-OAT3 (ATCC CRL-4031-OAT3) lines expressed the appropriate SLC gene with no mutations. Western blot analysis further confirmed the presence of the appropriate SLC protein in the OAT1- and OCT2-transfected clones. Digital PCR confirmed that RPTEC/TERT1-OAT1 has 7 copies of the OAT1 gene, RPTEC/TERT1-OCT2 has 5 copies of the OCT2 gene, and RPTEC/TERT1-OAT3 has 5 copies of the OAT3 gene (data not shown).
For the uptake assays, OAT1-expressing cells, OAT3-expressing cells, or control cells were seeded at 1 x 10⁵ cells/well in black-walled, collagen-coated 96-well plates. After 24 hours, the cells were washed in prewarmed Hank's Balanced Salt Solution (HBSS) (ATCC 30-2213), followed by a 10-minute incubation in HBSS at 37°C, 5% CO2. Cells were then incubated with 3 μM 6-CF (Thermo Fisher Scientific) for 20 minutes at 37°C, 5% CO2. After incubation, the reaction was terminated by washing the cells 4 times with cold HBSS. Cells were then lysed with M-Per Mammalian Protein Extraction Reagent (Thermo Fisher Scientific) and read immediately on a fluorescent plate reader at 490ex/530em or visualized by fluorescent microscopy. The OCT2 assay experiments were conducted in the same manner as the OAT1 and OAT3 assays with the exception of the substrate, which was 5 μM EAM-1. For the inhibition assays, OAT1-, OCT2-, or OAT3-expressing cells were incubated with the appropriate uptake chromophore. For OAT1- and OAT3-expressing clones, cells were incubated with varying concentrations of either probenecid (Sigma) or novobiocin (Sigma) for 10 minutes in 96-well plates, and then uptake was measured as described above. For OCT2-expressing clones, the cells were incubated with varying concentrations of either cimetidine (Sigma) or quinitin (Sigma) for 20 minutes in 96-well plates, and then uptake was measured as described above.
Figure 1. Generation of stably overexpressing OAT1, OCT2, and OAT3 RPTEC/TERT1 cell lines. RPTEC/TERT1 cells were transfected with plasmid DNA constructs containing either OAT1, OCT2, or OAT3. After 24 hours, transfected cells were grown under antibiotic selection for 7 days. The surviving cells were subjected to clonal isolation and were then expanded. The isolated clones were validated for clonality, kidney transporter expression, and kidney transporter activity.
Results
We confirmed the expression of OAT1, OCT2, or OAT3 in RPTEC/TERT1 by RT-PCR. The expression of OAT1 or OCT2 was verified by western blot. In addition, immunofluorescence revealed that the cells were positive for membrane-localized OAT1, OCT2, or OAT3 (Figure 2). Further, the clonal OAT1, OCT2, or OAT3 cells retain important characteristics of the parental counterpart RPTEC/TERT1 cell; dome formation and normal expression of CD13 and E-cadherin were observed in OAT1, OCT2, and OAT3 positive clones (Figure 3).
Next, we tested the ability of OAT1- and OAT3-expressing clones to uptake 6-CF, a known substrate of OAT1 and OAT3. We observed significant uptake ratios relative to the parental cells. Further, the uptake activity of OAT1- and OAT3-expressing clones was observed to be dose dependent (Figure 4). Similarly, we tested OCT2-expressing cells to uptake EAM-1, a known substrate of OCT2. As in the OAT1- and OAT3-expressing cells, we observed significant, concentration-dependent uptake ratios in OCT2-expressing cells relative to the parental cells (Figure 4).
We then tested the ability of various organic ion transporter inhibitors to block substrate transport into OAT1, OCT2, and OAT3-expressing cells. We observed that the compounds probenecid and novobiocin were able to block 6-CF (Probenecid: IC50=16.91 μM; novobiocin: IC50=59.17 μM) transport into RPTEC/TERT1-OAT1 (Figure 5). Similarly, probenecid and novobiocin blocked 6-CF (Probenecid: IC50=49.02μM; novobiocin: IC50=70.90 μM) uptake into RPTEC/TERT1-OAT3 (Figure 5). In the same regard, the compounds cimentidine and quintinin were able to block EAM-1 (Cimentidine: IC50=93.5 μM; quintinin: IC50=59.5 μM) entry into RPTEC/TERT1-OCT2 (Figure 5). The IC50 values that were observed in these experiments were similar to those reported in other competitive inhibition studies using the test compounds.4-8
Over the course of this project we generated and tested 3 new hTERT-immortalized, renal SLC protein models.
The new cell models displayed:
- Appropriate transporter protein expression and localization
- Key proximal tubule cell biologies
- Potent and specific transporter activity
Thus, these new SLC protein-expressing cell models are robust tools for toxicological testing.
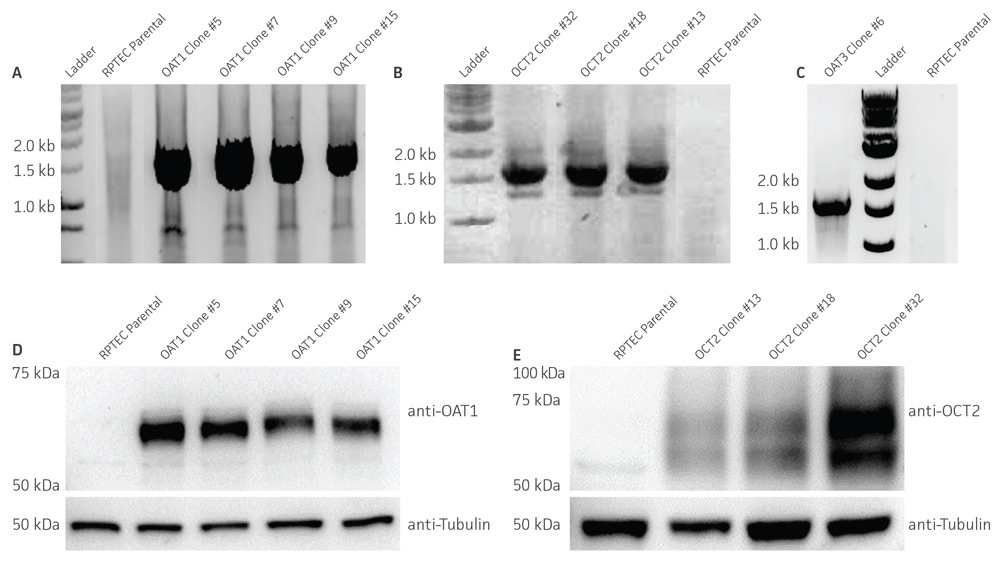
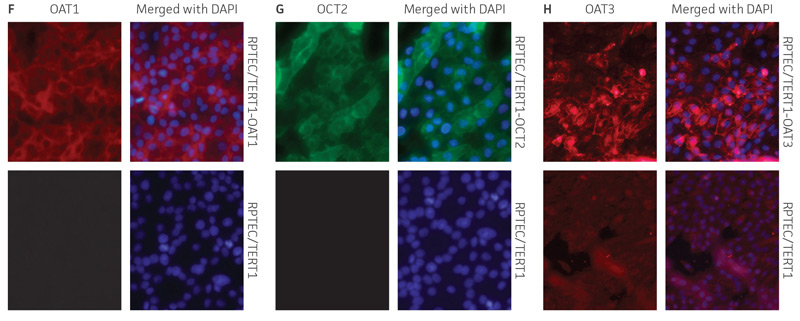
Figure 2. Characterization of the RPTEC/TERT1 SLC transporter cells. RT-PCR data demonstrates the presence of OAT1 (A), OCT2 (B), or OAT3 (C) mRNA in the respective cell lines. Immunoblot demonstrates the presence of OAT1 (D) and OCT2 (E) protein expression in the respective cell lines. Immunofluorescence demonstrates expression and plasma membrane localization OAT1 (F), OCT2 (G), or OAT3 (H), in the respective cell lines, but not the parental line. Original magnification, ×20.
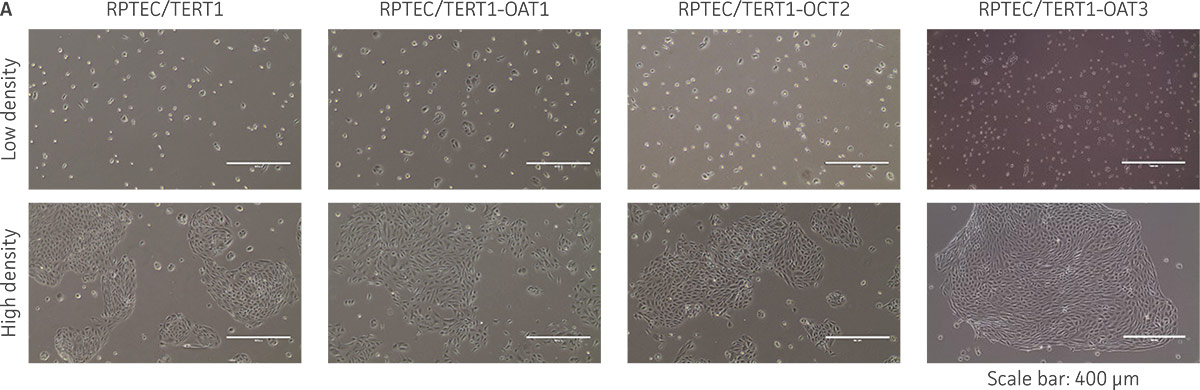
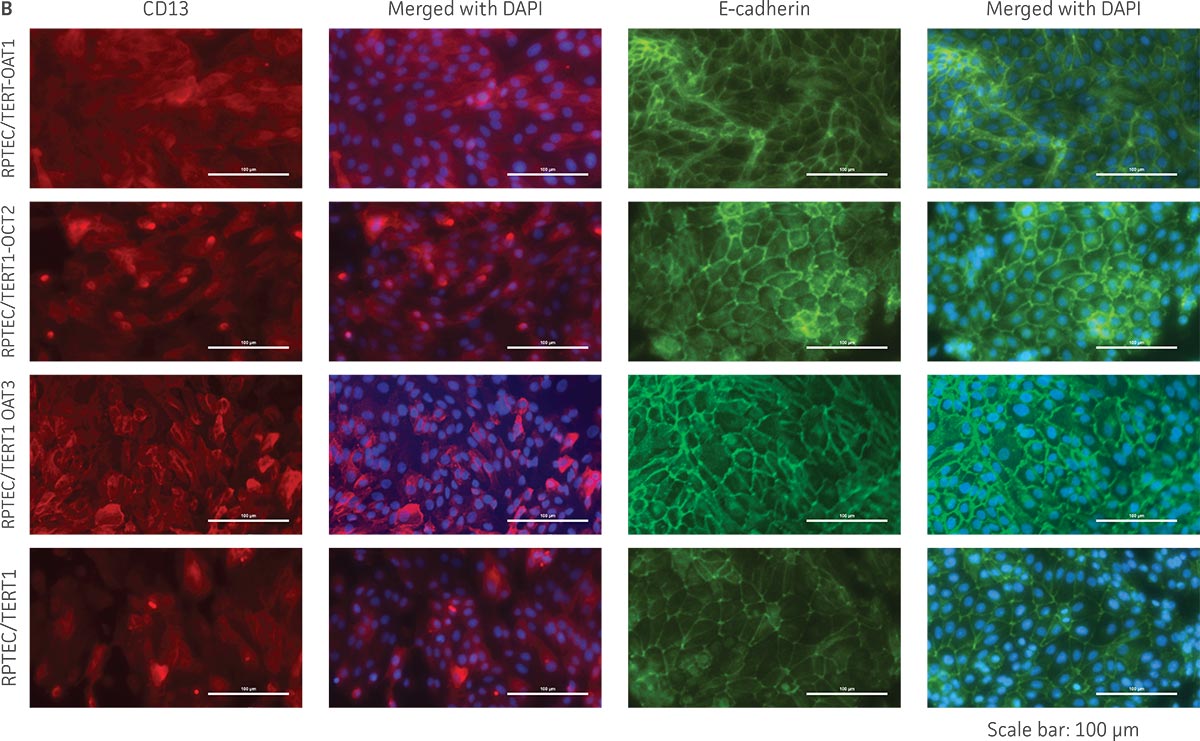
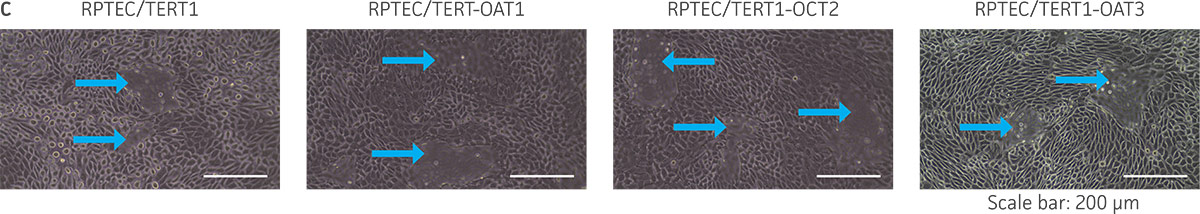
Figure 3. The RPTEC/TERT1 transporter cells retain the most important characteristics of the parental cells. RPTEC/TERT1 SLC transporter cells were subjected to immunostaining and dome formation assays. A) OAT1, OCT2, and OAT3 clones display the same renal epithelial growth pattern as parental RPTEC/TERT1 cells. B) The renal epithelial markers CD13 and E-cadherin are expressed in both parental RPTEC/TERT1 cells and in the OAT1, OCT2, and OAT3 lines. C) Dome formation is not compromised in OAT1-, OCT2-, and OAT3-expressing cells, as demonstrated by the formation of dome-like structures (arrows) caused by solute transport across an intact epithelial barrier.
Figure 4. SLC transporter-expressing cells display potent substrate uptake activity. Solute uptake activity of (A) OAT1- and (C) OAT3-expressing cells was assessed using 6-CF as a substrate. Solute uptake activity of (B) OCT-2 was assessed using EAM-1 as a substrate. As expected, uptake increases with increasing substrate concentration in solute transporter-expressing cells but not in parental RPTEC/TERT1 cells (n=3; error bars indicate standard deviation), indicating that the observed transport is due to OAT1, OCT2, or OAT3 expression.
Figure 5. SLC transporter-expressing cells demonstrate highly specific uptake activities. OAT1-expressing cells were exposed to increasing concentrations of the known OAT inhibitors A) probenecid and B) novobiocin while 6-CF concentration and uptake time were held constant at 3 μM and 20 minutes, respectively. OCT2-expressing cells were exposed to increasing concentrations of the known OCT2 inhibitors C) cimetidine and D) quinitin while EAM-1 concentration and uptake time were held constant at 5 μM and 20 minutes, respectively. OAT3-expressing cells were exposed to increasing concentrations of the known OAT inhibitors E) probenecid and F) novobicin while 6-CF concentration and uptake time were held constant at 3 μM and 20 minutes, respectively. The resulting inhibition curves indicate that OAT1, OCT2, and OAT3 transport activity was substrate specific when overexpressed in RPTEC/ TERT1 cells (n=3; error bars indicate standard deviation).
Summary and conclusions
A central problem in preclinical studies is the lack of models that display key features of the kidney, such as the renal microenvironment and expression of the appropriate SLC proteins. In this regard, we have generated and characterized cellular models for renal solute uptake by stably expressing OAT1, OCT2, and OAT3 in hTERT-immortalized human primary RPTEC/TERT1. The OAT1-, OCT2-, and OAT3-overexpressing cells retained the relevant renal epithelial characteristics of the parental primary cells, and stable transporter expression was confirmed by PCR, immunostaining, and immunoblot. All 3 cell models showed highly sensitive and specific substrate uptake activities, making them valuable tools for drug-drug interaction studies and/or preclinical toxicology testing to support clinical therapeutic development. Further, the transport activity in all 3 cell models was inhibited by known SLC inhibitors such as probenecid, quintin, novobiocin, and cimetidine. Thus, the proliferative capacity, in vivo-like qualities, and substrate sensitivity and specificity of RPTEC/TERT1-OAT1 (ATCC CRL-4031-OAT1), RPTEC/TERT1-OCT2 (ATCC CRL-4031-OCT2), and RPTEC/TERT1-OAT3 (ATCC CRL-4031-OAT3) establish these cells as valuable, physiologically relevant models of kidney function.
Download a PDF of this application note
Download NowReferences
- Guidance for Industry: Drug Interaction Studies-Study Design, Data Analysis, Implications for Dosing, and Labeling Recommendations. US Food and Drug Administration. Feb, 2012.
- Wieser M, et al. hTERT alone immortalizes epithelial cells of renal proximal tubules without changing their functional characteristics. Am J Physiol-Renal Physiol 295: F1365–F1375, 2008.
- The International Transporter Consortium. Membrane transporters in drug development Nat Rev Drug Disc. 9: 215-235, 2010.
- Ho ES, et al. Cytotoxicity of antiviral nucleotides adefovir and cidofovir is induced by the expression of human renal organic anion transporter 1. J Am Soc Nephrol 11(3) : 383-93, 2000. PubMed: 10703662
- Takeda M, et al. Characterization of organic anion transport inhibitors using cells stably expressing human organic anion transporters. Eur J Pharmacol. 419(2-3):113-20, 2001. PubMed: 11426832
- Chu XY, et al. Transport of the dipeptidyl peptidase-4 inhibitor sitagliptin by human organic anion transporter 3, organic anion transporting polypeptide 4C1, and multidrug resistance P-glycoprotein. J Pharmacol Exp Ther 321(2):673-83, 2007. PubMed: 17314201
- Zolk O, et al. Structural determinants of inhibitor interaction with the human organic cation transporter OCT2 (SLC22A2). Naunyn Schmiedebergs Arch Pharmacol. 379(4):337-48, 2009. PubMed: 19002438
- Ito S, et al. Competitive inhibition of the luminal efflux by multidrug and toxin extrusions, but not basolateral uptake by organic cation transporter 2, is the likely mechanism underlying the pharmacokinetic drug-drug interactions caused by cimetidine in the kidney. J Pharmacol Exp Ther 340(2):393-403, 2012. PubMed: 22072731