Authors: Penney McWilliams-Koeppen, MS, and James Clinton, PhD
Introduction
Materials and methods
Results
Discussion
References
Abstract
Herein we describe a flow cytometry-based assay utilizing K-562 cells stably expressing green fluorescent protein (ATCC CCL-243-GFP) to quantify the cytotoxic activity of primary human natural killer cells. The assay was performed using cryopreserved natural killer cells, with a hands-on time of under 2 hours. Specific lysis ranged from 2% to 57%, depending on the effector: target ratio and the donor (n=2). For many applications this cell line may provide a more reproducible and preferable alternative to methods requiring pre-loading of cells with fluorescent or radioactive materials.
Download a PDF of this application note
Download NowIntroduction
Natural killer (NK) cells are the major effectors of the innate immune system and are important in host defense, cancer, and autoimmunity.1 Generally, NK cells can be divided into 2 sub-populations by their surface expression of CD56. Approximately 10% of circulating NK cells express CD56bright and are responsible for secreting immunoregulatory cytokines that function in adaptive immunity. The remaining ~90% of circulating NK cells are CD56dim and exhibit direct cytotoxic activity via granzyme/perforin/death receptor pathways against cells that have lost the expression of major histocompatibility complex (MHC) class I, or “self”, surface markers. Cells without MHC class I molecules include malignant, foreign, virus-infected, or otherwise atypical cells; therefore, NK cell recognition and attack provides a valuable, early method of host protection.1 The MHC class I-deficient myelogenous leukemia line, K-562 (ATCC CCL-243), is a classical target for the in vitro measurement of NK cell cytotoxicity and the degree of K-562 lysis directly correlates with NK cell activity.2
The accurate quantitation of NK cell cytotoxic activity is clinically relevant in cancer,3-5 autoimmunity and immunodeficiency,6-8 reproductive medicine,9 transplant medicine,10 and viral diseases.11 Historically, the gold standard for measuring NK cell cytotoxic activity in vitro has been the radioactive 51chromium- (51Cr) release assay, in which target cells, such as K-562, are loaded with 51Cr, and NK-directed target cell lysis is calculated from the amount of 51Cr released into the cell supernatant.12 While commonly used, this method has many disadvantages including regulatory paperwork, high cost, the need for specialized equipment, a short reagent half-life, and the generation of hazardous waste.
As an alternative to the 51Cr release assay, the cytotoxic effect of NK cells can be measured by flow cytometry with fluorophore-labeled target cells using fluorescent dyes.13 One major drawback to using dye-loaded targets is the potential for intra- and inter-assay variability that stems from inconsistent dye uptake and spontaneous dye leakage over the course of the assay.14
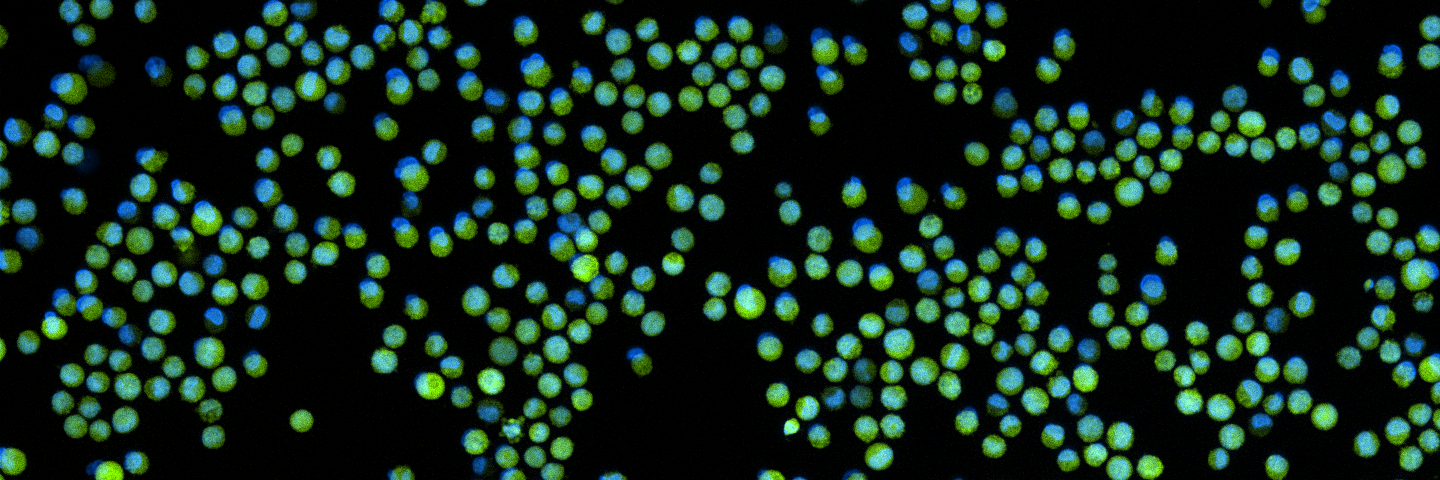
We have addressed these drawbacks, creating an improved target for NK cell activity with a cell line that endogenously and stably expresses a fluorescent protein.15 Here we describe the use of a clonal K-562 line engineered to express green fluorescent protein (GFP), K-562-GFP (ATCC CCL-243-GFP), that can be incorporated into cytotoxicity assays with no upstream preparation time. This cell line was derived from a single K-562 parental cell and stably expresses GFP under the control of the human EF-1 alpha promoter. The cells exhibit a uniform, high-intensity fluorescence that is consistent over time in culture. Because these target cells do not need to be loaded with fluorescent dye prior to use and can be maintained in culture in a ready-to-use state, assay times are significantly shorter (see Figure 1). In addition, the reproducible and stable GFP signal greatly reduces inter-assay and intra-assay variability.
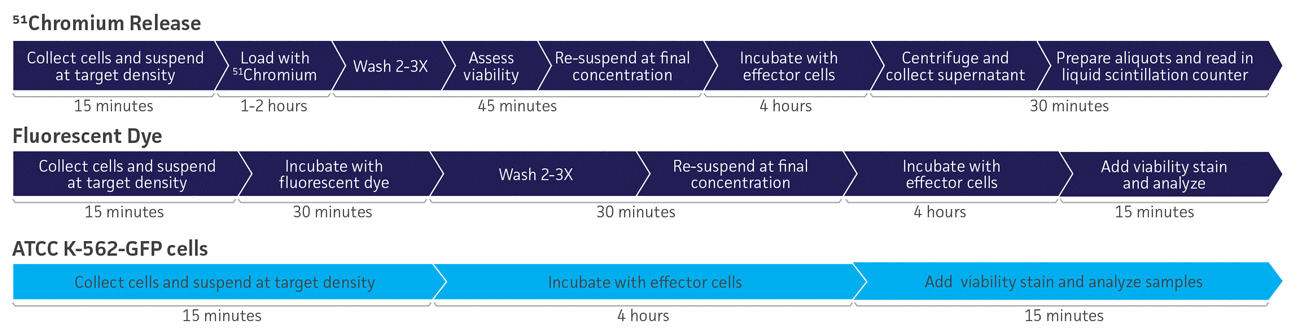
Figure 1. Workflow comparison of 3 different methods for quantifying natural killer cell cytotoxicity. Use of ATCC K-562-GFP cells reduces assay steps and hands-on time, when compared to other methods.
Materials and methods
K-562-GFP culture:
K-562-GFP cells (ATCC CCL-243-GFP) were thawed, counted, and assessed for viability via trypan blue exclusion. Prior to assays, the cells were maintained according to ATCC guidelines in a humid incubator at 37°C with 5% CO2 between 1 × 10⁵ cells/mL and 1 × 10⁶ cells/ mL in Iscove’s Modified Dulbecco’s Medium (IMDM; ATCC 30-2005) containing 10% Fetal Bovine Serum (FBS; ATCC 30-2020) and 0.5 μg/mL puromycin hydrochloride (Sigma-Aldrich). Immediately prior to each NK cell cytotoxicity assay, the K-562-GFP cells were counted and viability was assessed. The cells were then pelleted at 200 × g for 5 minutes and resuspended to 8 × 10⁵ cells/mL in pre-warmed RPMI-1640 Medium (ATCC 30-2001) with 10% FBS.
Killed target detection by flow cytometry:
K-562-GFP cells were killed by incubating at 90°C in a heat block for 10 minutes. They were then mixed into a suspension of live K-562-GFP cells at a final concentration of either 25%, 50%, or 75% in Dulbecco’s Phosphate Buffered Saline (D-PBS; ATCC 30-2200). The three combinations of live/killed cell suspensions, along with 100% live cell and 100% killed cell suspensions, were then stained with 7-aminoactinomycin D (7-AAD; BioLegend) at 0.25 μg per sample for 10 minutes at room temperature in the dark. The percentage of 7-AAD+ GFP+ cells in the upper right quadrant of a 7-AAD vs. GFP dot plot was measured with an Accuri C6 flow cytometer (BD) equipped with a 488 nm argon laser. GFP fluorescence was detected on FL1 and 7-AAD fluorescence was detected on FL3. Ten thousand events were acquired per sample.
NK cell preparation:
Cryopreserved adult human CD56+ NK cells (ATCC PCS-800-019) purified by immunomagnetic bead separation were obtained from two different donors and stored in liquid nitrogen prior to use. NK cells were thawed quickly at 37°C and the cells were resuspended in 12 mL warm RPMI-1640 containing 10% FBS. Cells were counted and viability assessed by trypan blue exclusion. The NK cell suspension was pelleted at 200 × g for 5 minutes and resuspended to 1 × 10⁷ cells/mL in the FBS-containing RPMI-1640.
NK cell cytotoxicity assay:
Assays were performed in V-bottom polystyrene 96-well plates with lids. Each effector:target (E:T) combination was set up in triplicate wells in RPMI with 10% FBS, and controls included NK cells alone and K-562-GFP cells alone. First, using a multichannel pipettor, the NK cells were serially diluted 1:2 directly in the V-bottom 96-well plate from 1 × 10⁶ cells per well to 62,500 cells per well, in a final volume of 100 μL. Next, 50 μL of K-562-GFP cells at 8 × 10⁵ cells/mL were added with a multichannel pipettor to all wells except the NK control cell wells. All wells were adjusted to a final volume of 150 μL with RPMI-1640 containing 10% FBS. The plate was centrifuged for 1 minute at 100 × g and placed in a cell culture incubator at 37°C and 5% CO2 for 4 hours.
Flow cytometry:
Following the 4-hour incubation of NK cell effectors and K-562-GFP targets, the contents of the V-bottom plate were transferred using a multichannel pipettor to 96-well polypropylene tubes. The plate wells were rinsed once with 100 μL ice cold Cell Staining Buffer (BioLegend), and this was combined with the contents in the 96-well tubes. Cells were stained with 7-AAD at 0.25 μg per sample for 10 minutes at room temperature in the dark. The cytotoxic effect of the NK cells, as indicated by the accumulation of 7-AAD+ GFP+ targets, was measured with a BD Accuri C6 flow cytometer, equipped with a 488 nm argon laser. GFP fluorescence was detected on FL1 and 7-AAD fluorescence was detected on FL3. Thirty thousand events were acquired per sample.
Gating strategy:
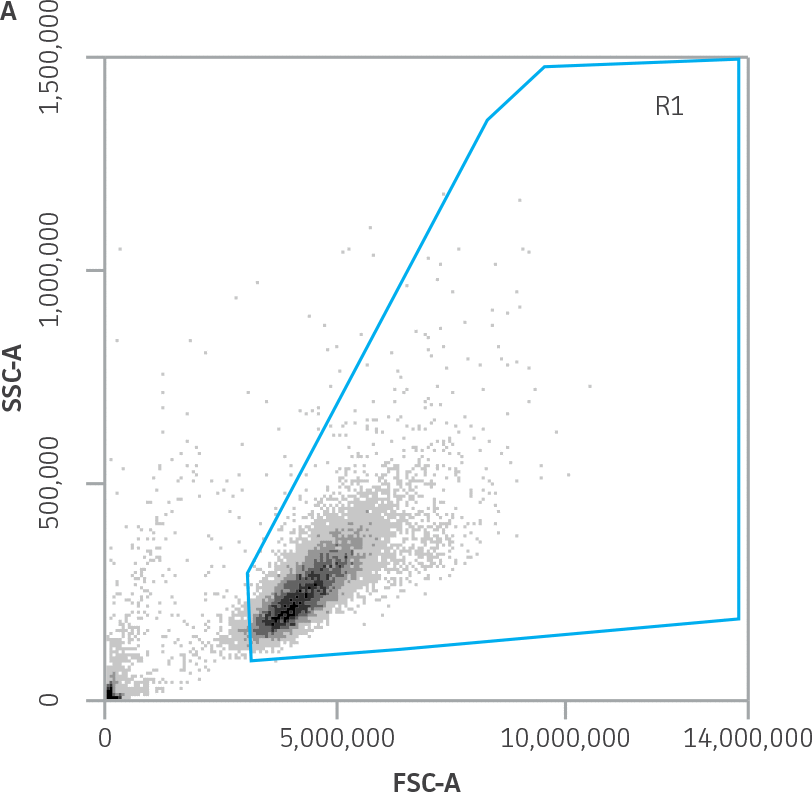
Using the K-562-GFP alone samples, a polygonal gate (R1) was drawn to identify the live K-562-GFP population on a forward scatter (FSC) vs. side scatter (SSC) dot plot (Figure 2A). The NK cells alone samples were used to draw a rectangular gate (R2) in the lower left corner of the FSC vs. SSC plot (Figure 2B). This gate was used to exclude the NK cells from the analysis of killed target cells.
 |
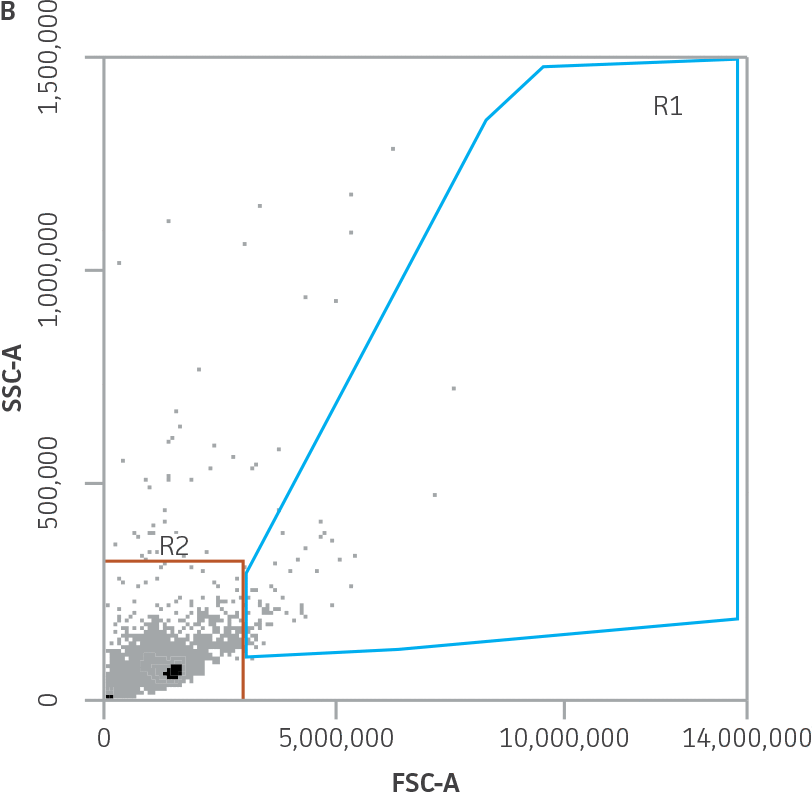 |
Figure 2. Forward scatter vs. side scatter gating strategy for K-562-GFP and NK cell populations. A) R1 contains the live K-562-GFP population (K-562-GFP control cells sample). B) R2 contains the NK cell population (NK control cells sample). This gate also contains debris.
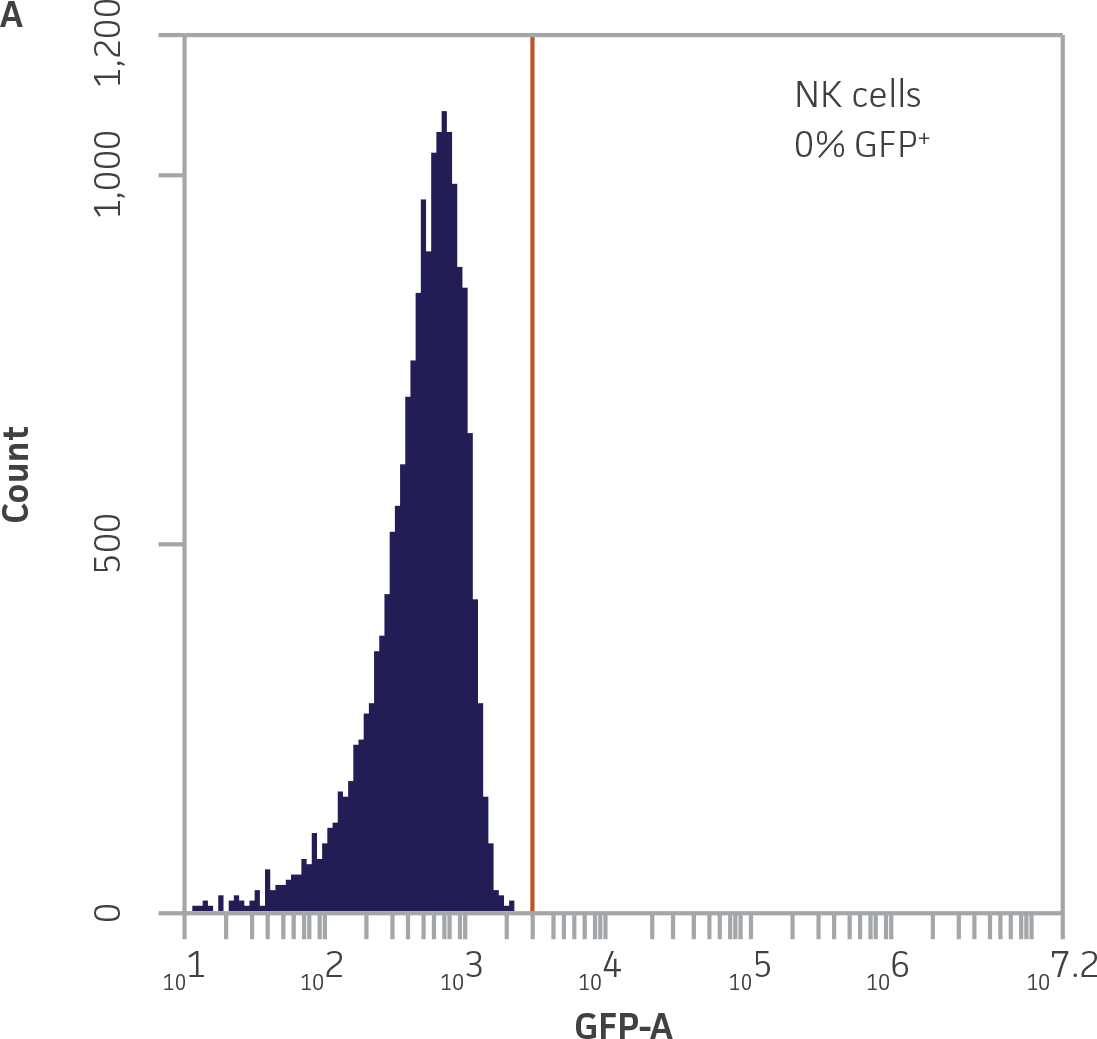
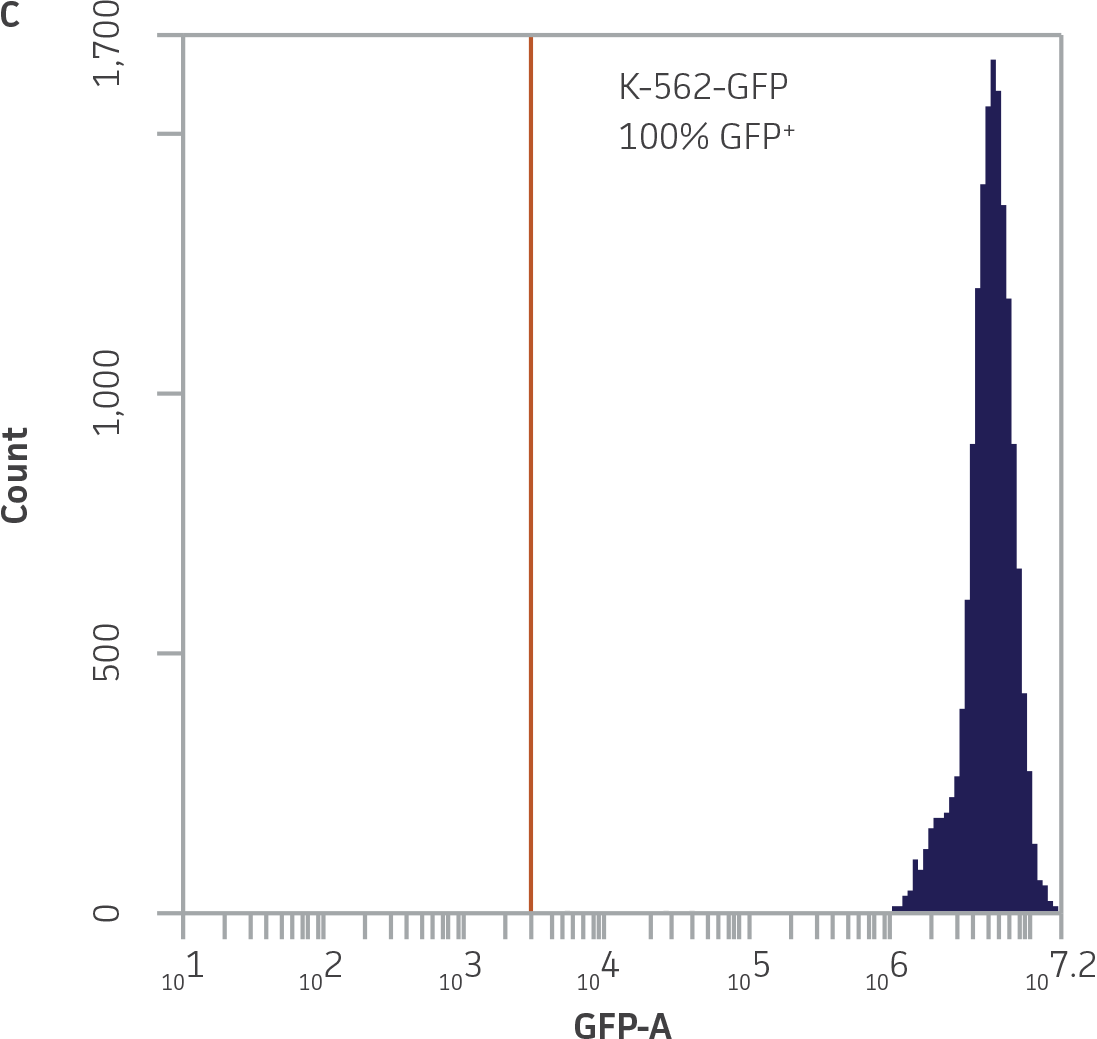
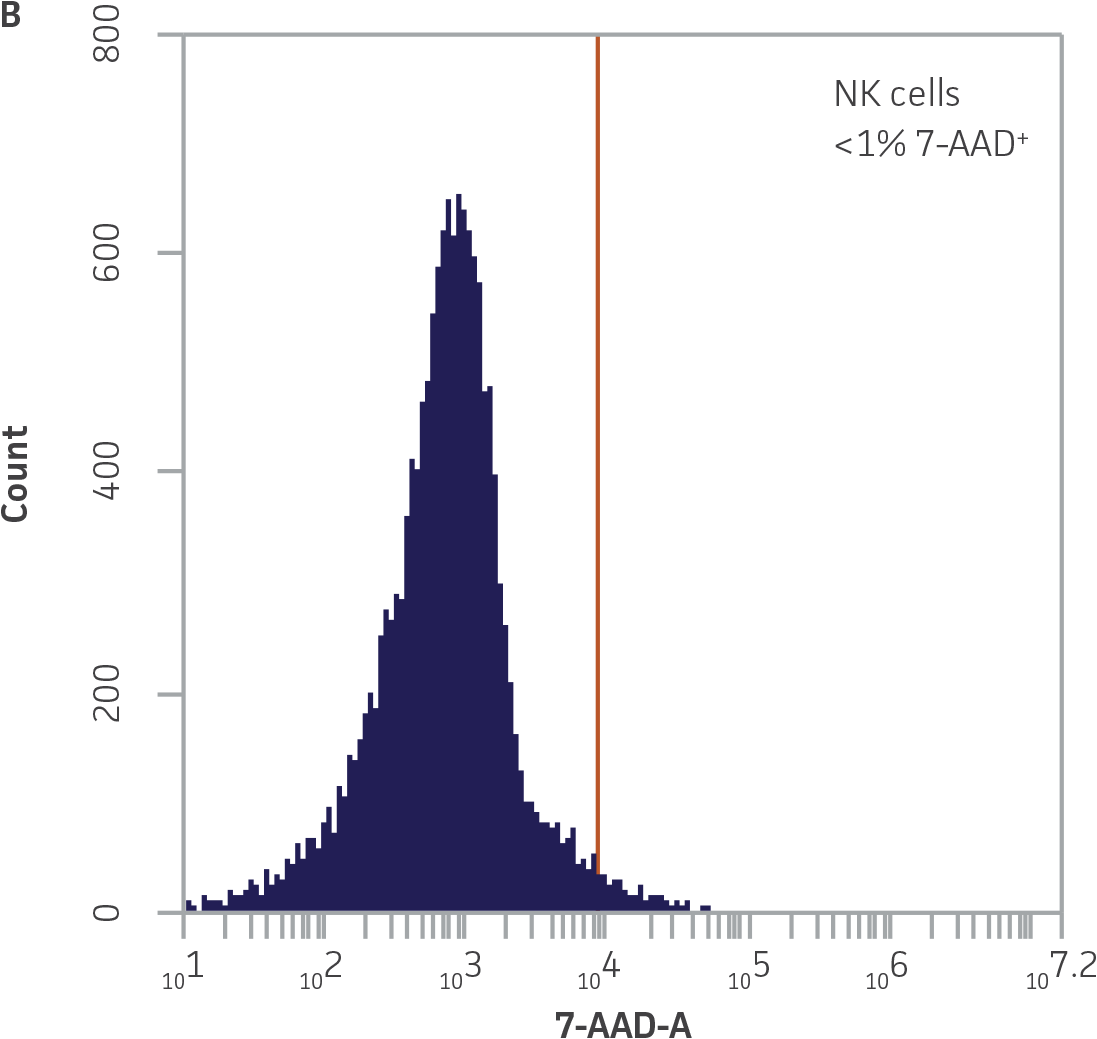
Within the populations contained in R1 (live K-562-GFP cells) and R2 (NK cells), vertical gates were placed on the GFP and 7-AAD single channel histogram plots to delineate GFP¯ and 7-AAD- cells (Figure 3).
 |
 |
 |
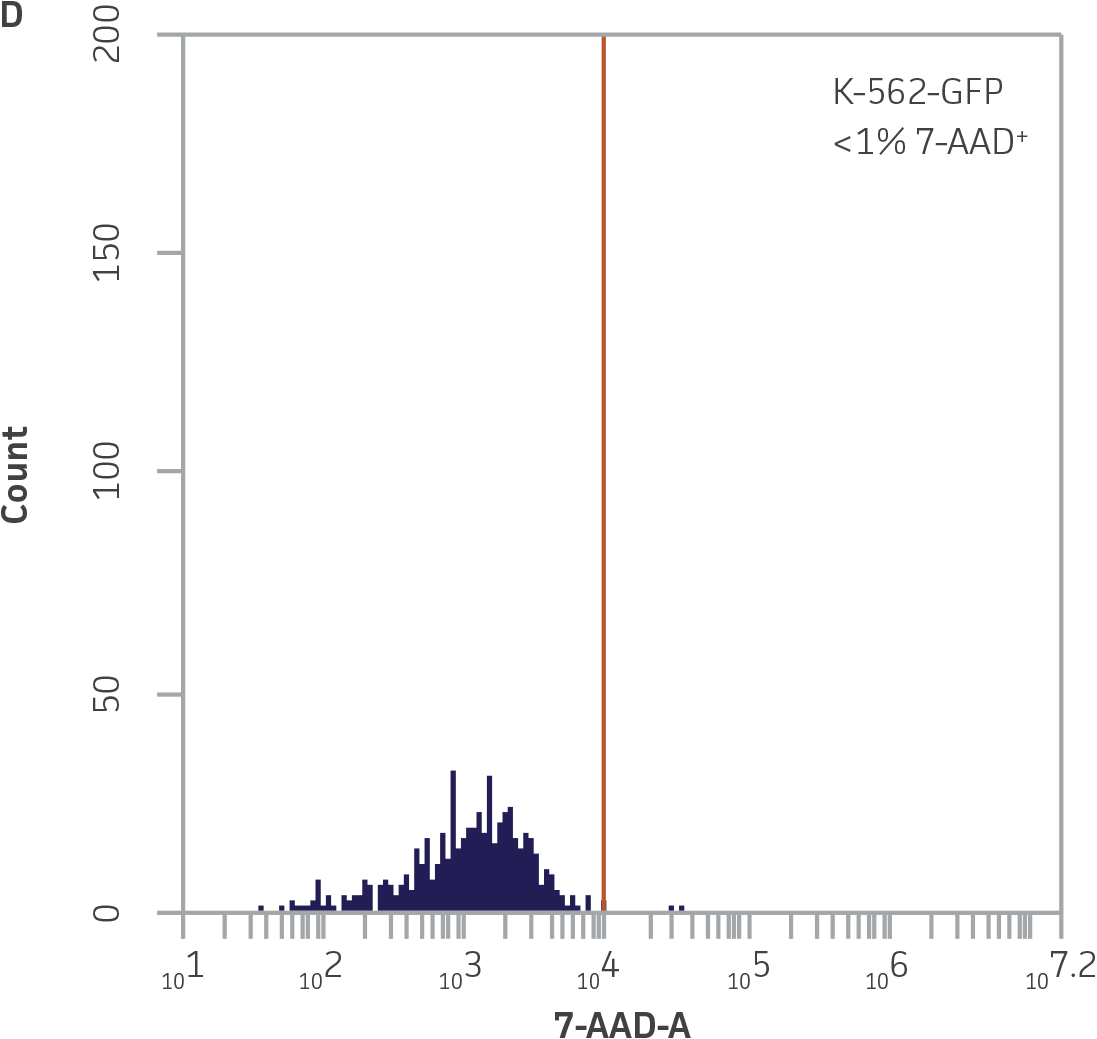 |
Figure 3. Vertical gating strategy to delineate GFP-negative and 7-AAD-negative cells within the NK and K-562-GFP populations. A) GFP histogram plot containing the NK cell population. The vertical gate marks the maximum fluorescence intensity on FL1 within this population. B) 7-AAD histogram plot containing the NK cell population. The vertical gate marks the background fluorescence intensity on FL3 within this population. C) GFP histogram plot containing the live K-562-GFP population. D) 7-AAD histogram plot containing the live K-562-GFP population. The vertical gate marks the background fluorescence within this population.
The fluorescence intensity settings from the GFP and 7-AAD vertical gates on their respective single channels (Figure 3) were used to set a quadrant gate on a GFP vs. 7-AAD dot plot of all events outside R2 (Figure 4).
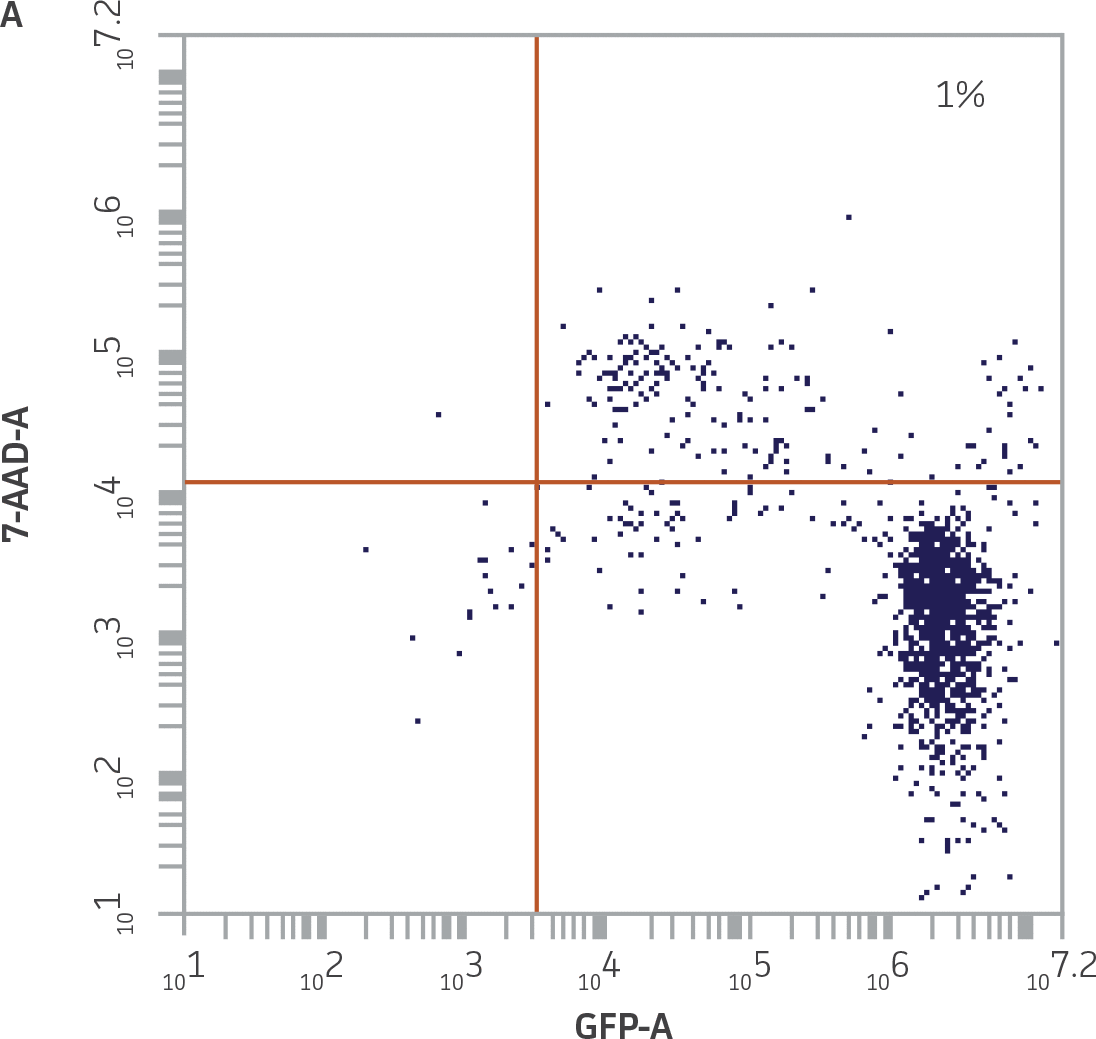 |
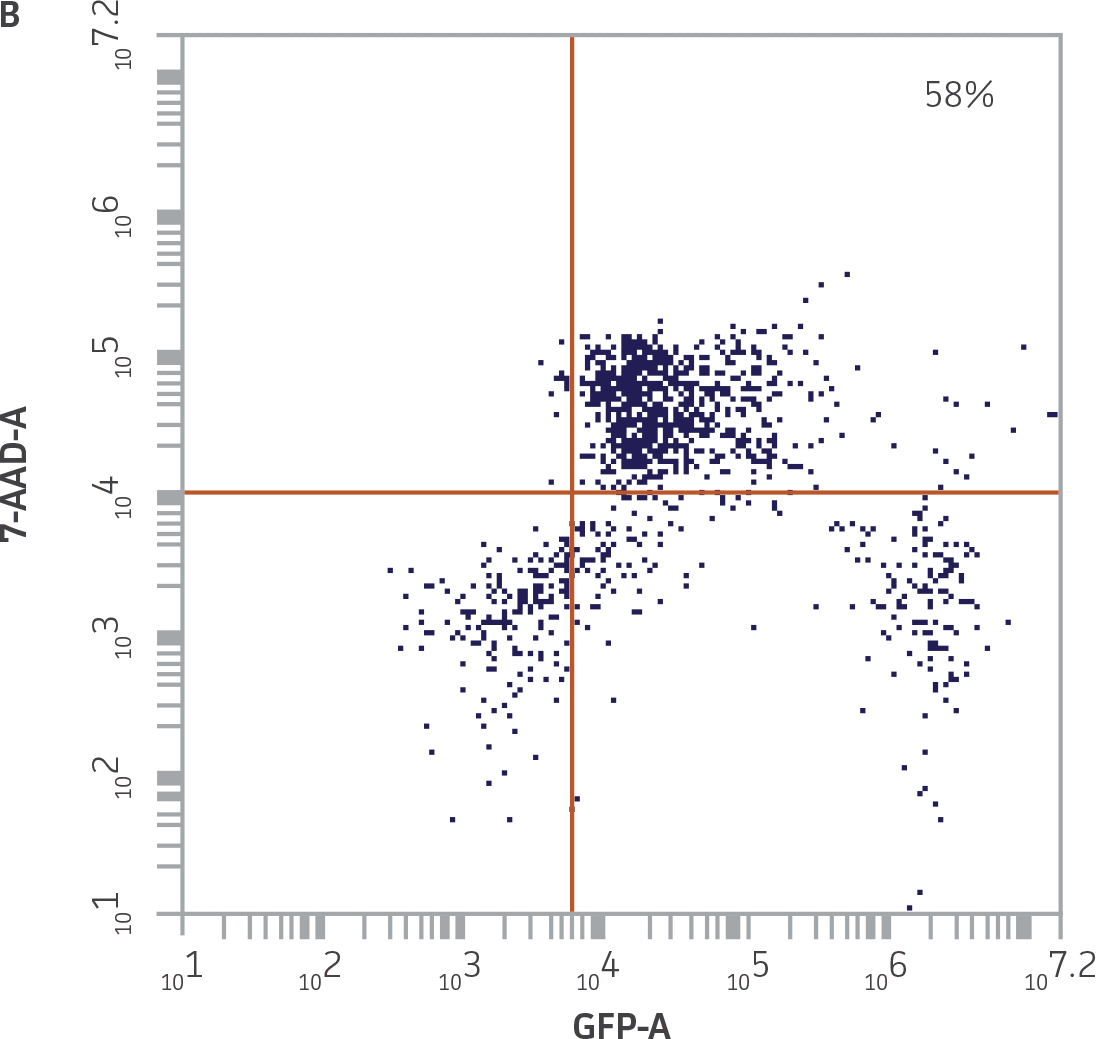 |
Figure 4. Quadrant plot gating strategy to identify killed K-562-GFP targets. A) Undamaged K-562-GFP cells from the K-562-GFP control samples were GFP+ and 7-AAD-, and accumulated in the lower right quadrant. The percentage of cells in the upper right (UR) quadrant reflects the minimal level of spontaneous death in this population. B) Killed K-562-GFP cells from a 25:1 E:T combination (donor 2), were GFP+ and 7-AAD+, and accumulated in the UR quadrant. NK cells were removed from this analysis by excluding events acquired in R2.
The percentage of effector-lysed targets was quantified by the percentage of 7-AAD+ GFP+ cells detected in the upper right quadrant of the GFP vs. 7-AAD dot plot. This population was composed solely of targets, since the NK effectors were excluded from the analysis. Note that a very small number of NK cells could potentially fall outside the R2 gate; based on the intensity setting of the vertical gate on the GFP axis, these events would not be detected as GFP+.
The percentage of 7-AAD+ GFP+ cells in the 3 replicates of the K-562-GFP control cells samples were averaged and this value was used as “mean background” in the formula used to calculate percent specific lysis for each E:T ratio:
[% 7AAD+GFP+ targets (test wells)] – [mean % 7AAD+GFP+ targets (control wells)] × 100 = % specific lysis
100 – [mean % 7AAD+GFP+ targets (control wells)]
Because the spontaneous death of K-562-GFP cells is typically below 1.5% (Figure 3A), the use of the formula for specific lysis is optional and instead the percentage of 7-AAD+ GFP+ targets can be used directly to determine killing activity.
Results
K-562-GFP cells were 90.7% viable upon thaw. After 24 hours of culture, the cells achieved 98% viability, which was maintained throughout their time in culture.
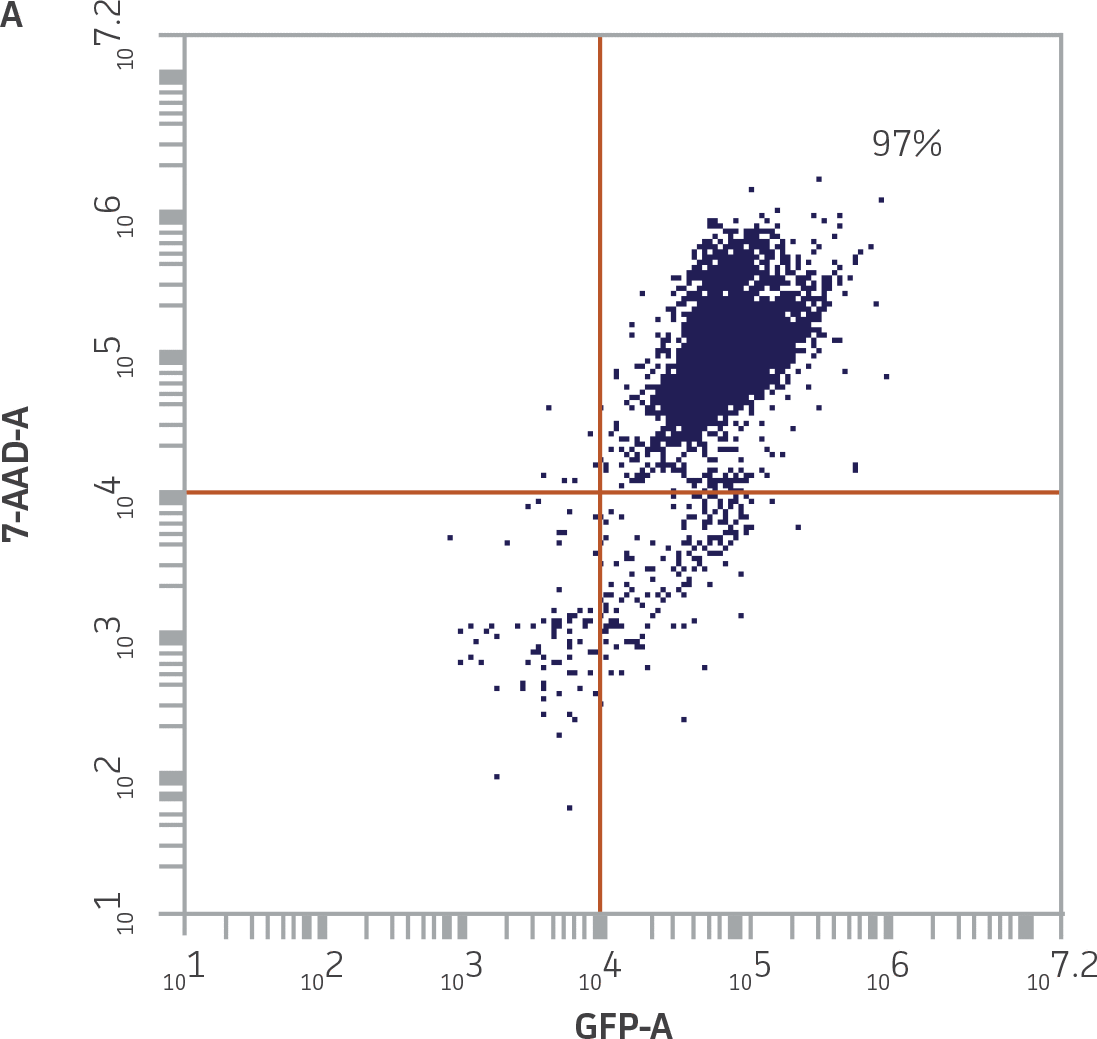
The accurate discrimination of viable and non-viable K-562-GFP cells by flow cytometry was confirmed by adding a known percentage of heat-killed cells into a suspension of live cells, staining with 7-AAD, and then measuring the percentage of 7-AAD+ GFP+ events. There was a strong linear relationship between the percentage of killed K-562-GFP cells added to each sample and the percentage of 7-AAD+ GFP+ cells collected (Figure 5).
 |
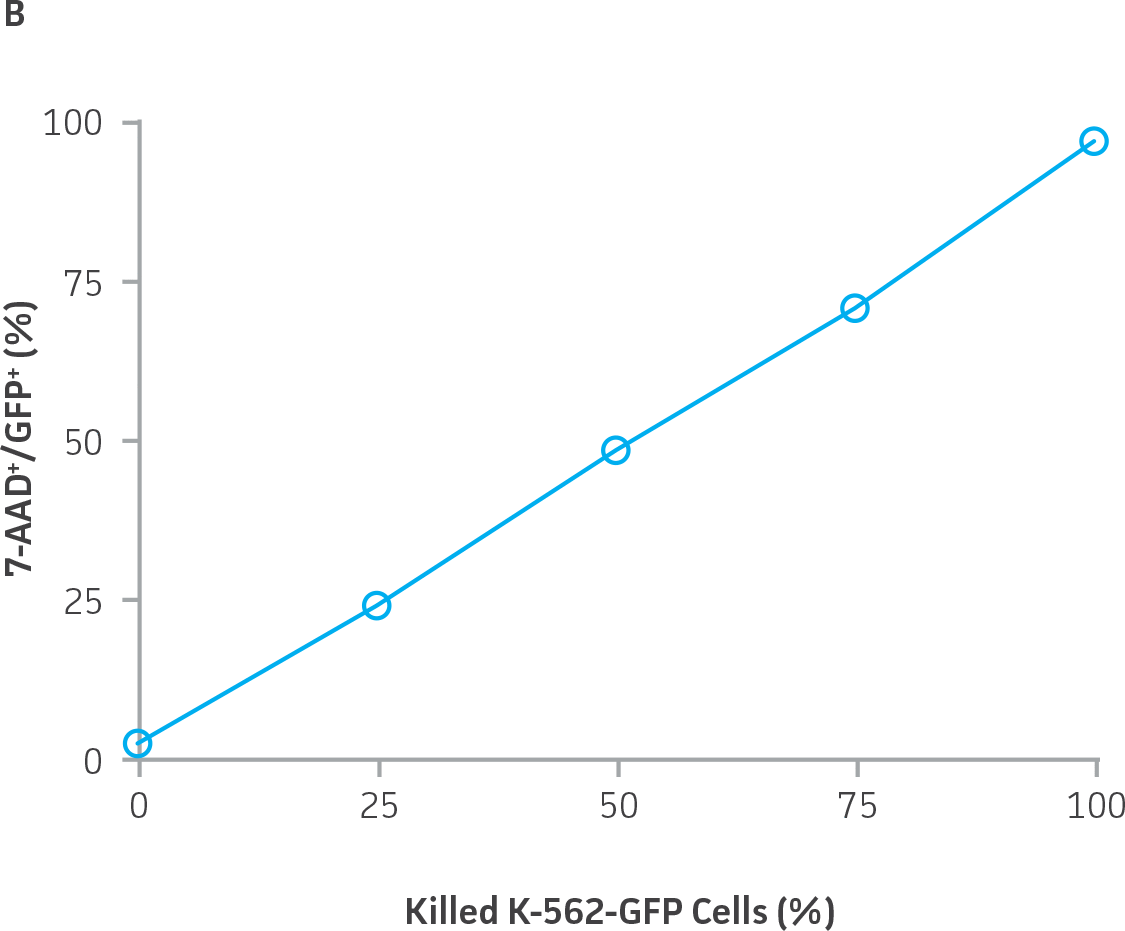 |
Figure 5. Accurate detection of non-viable K-562-GFP cells by flow cytometry using 7-AAD. A) Heat-killed K-562-GFP cells were 7-AAD+ and GFP+, and accumulated in the upper right quadrant of a GFP vs. 7-AAD dot plot. B) The percentage of 7-AAD+ GFP+ K-562-GFP cells correlated with the percentage of dead cells added, r2=0.999.
Upon thaw, the viability of the cryopreserved NK cells from donors 1 and 2 was >90% (Table 1).
Table 1. Donor characteristics and post thaw recovery of cryopreserved NK cells from two donors.
| ID | Age | Gender | Source | Selection method | Markers | Vial | % Viability |
|---|---|---|---|---|---|---|---|
| Donor 1 | 37 | M | Leukopak | positive | CD56+, CD45+ | 1 2 |
97 92 |
| Donor 2 | 51 | M | Leukopak | negative | CD56+, CD45+, CD3- | 1 2 |
92 93 |
The percentage of K-562-GFP targets killed at each E:T ratio varied between donors, with donor 1 giving an average of 37% specific lysis at the highest E:T ratio (25:1). The NK cells from donor 2 effected a higher degree of cytotoxicity, with an average of 56% specific lysis at the highest E:T ratio (25:1). There was a strong dose dependency between the percentage of killed targets and the E:T ratios (Figure 6).
Two independent assays were performed using 2 separate vials of each donor on 2 separate days, with highly concordant results between the 2 assays for each donor (Figure 7). Results across the 2 days between the two independent assays were highly correlated for both donors (donor 1: r2=0.96, donor 2: r2=0.99).
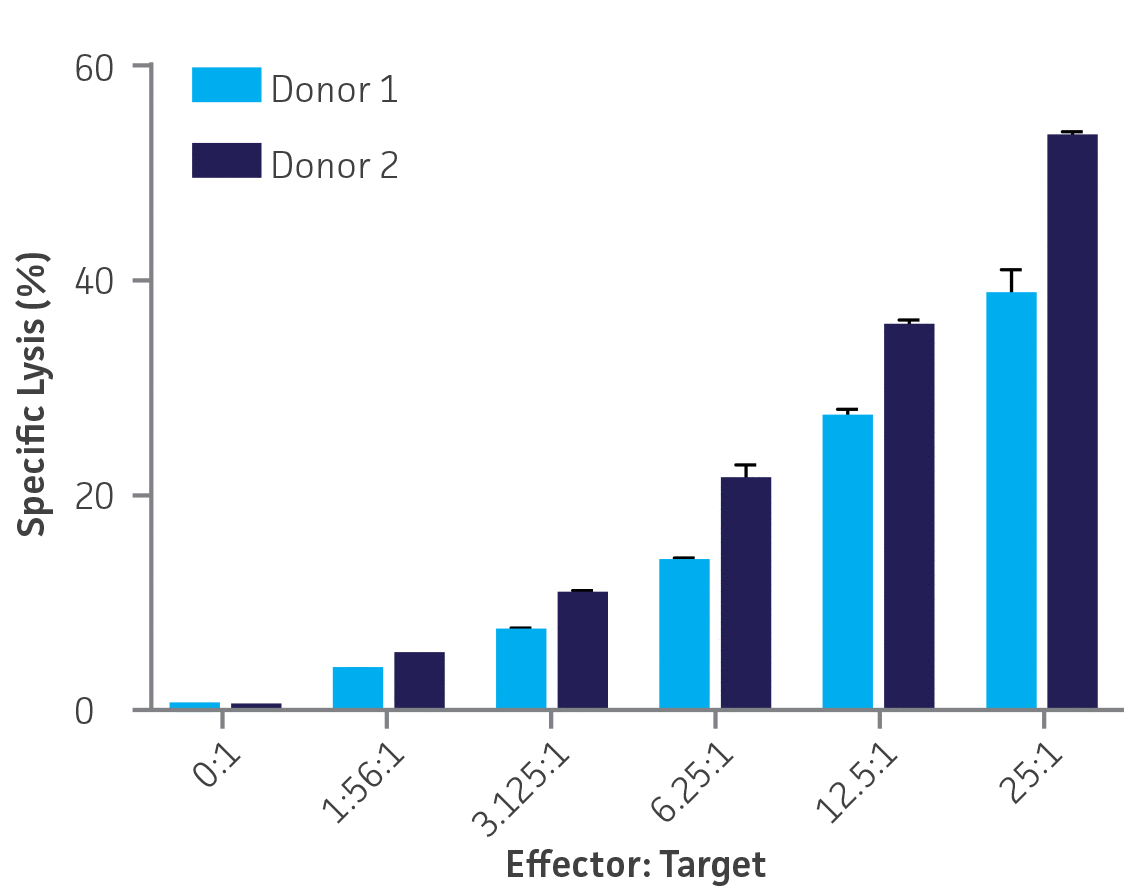
Figure 6. Donors 1 and 2, single assays, n=3 wells per E:T ratio. Plotted as means ± standard deviation.
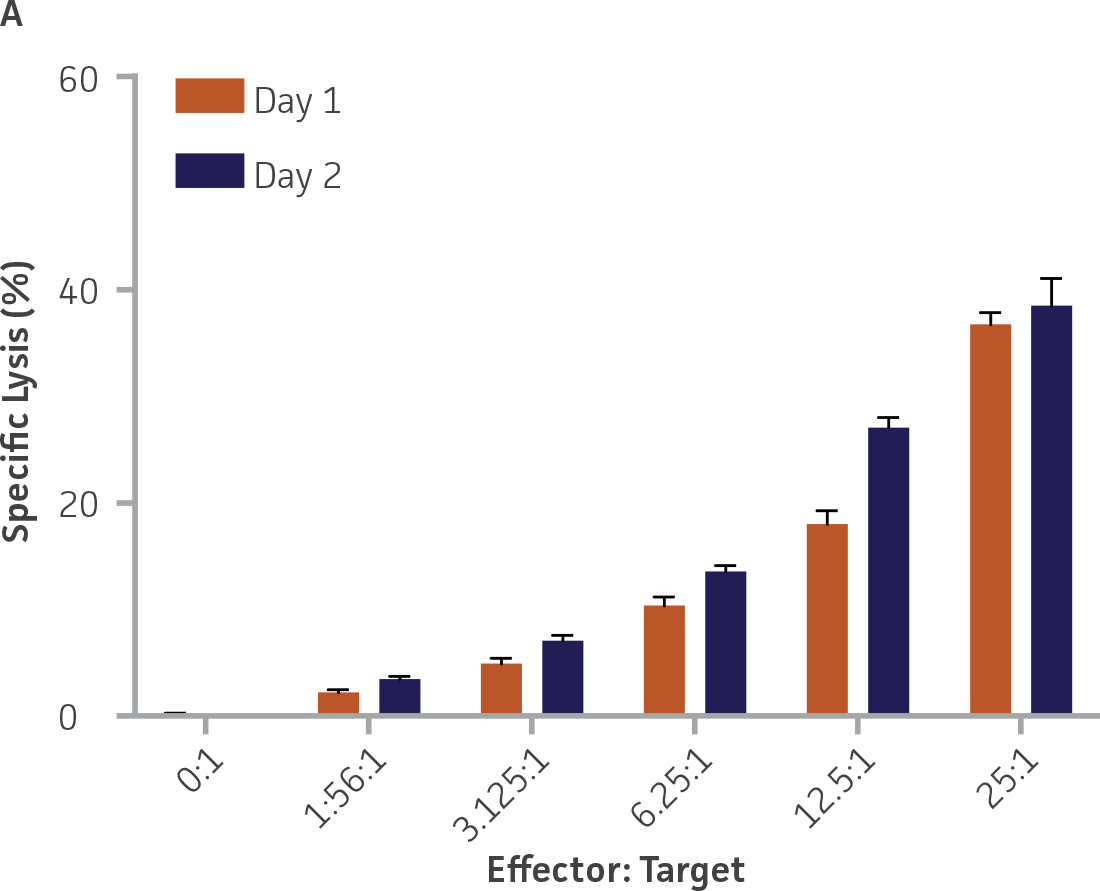
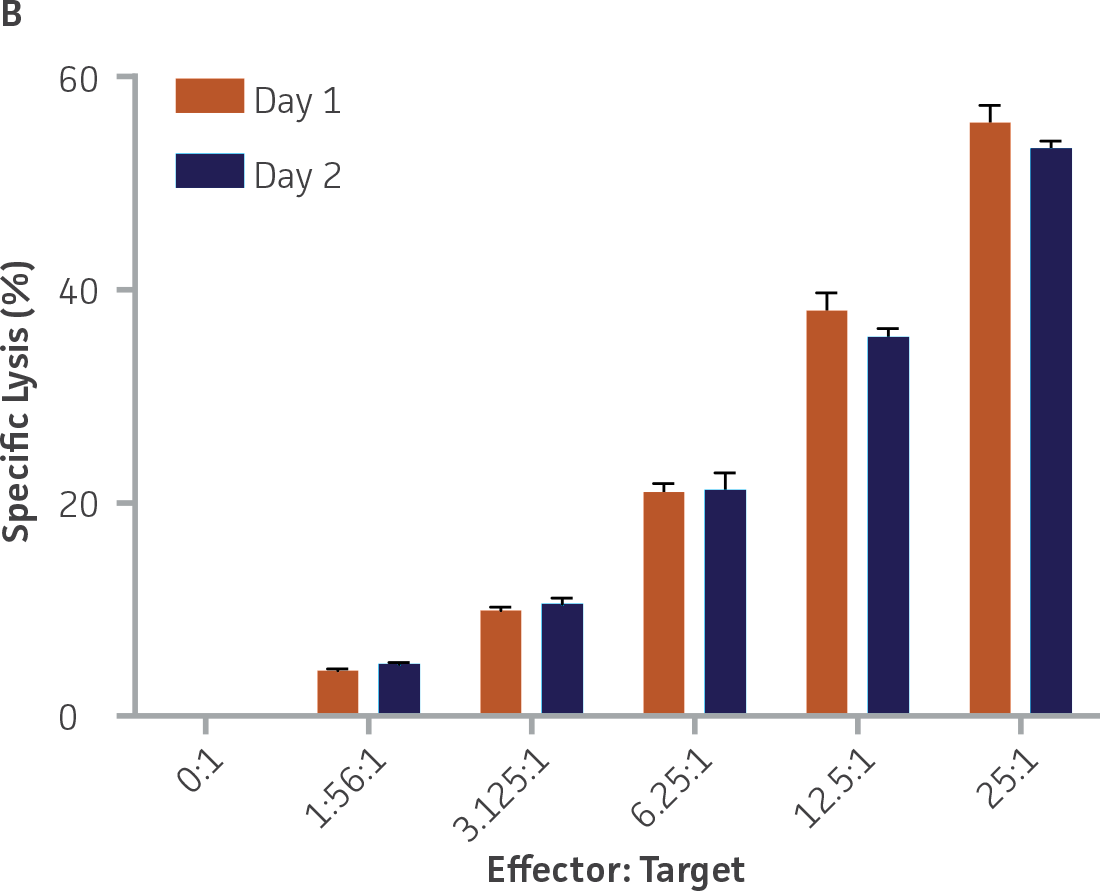
Figure 7. Donors 1 (A) and 2 (B) across 2 independent assays. n=3 wells per E:T ratio per day. Plotted as means ± standard deviation.
Discussion
The ability to measure NK cell cytotoxicity in vitro quickly, accurately, and reproducibly is valuable in a variety of research and clinical applications, especially in the fields of autoimmune diseases and cancer immunotherapy.16,17
The K-562-GFP cell line provides a convenient, highly reliable, authenticated, and standardized source of targets for use in the study of NK cell cytotoxic effects. We demonstrate that the K-562-GFP targets are killed by NK cells in a dose-dependent manner, and that the degree of specific lysis is in agreement with other published studies of NK cell activity.18 Further, the assay was sufficiently sensitive to detect differences in cytotoxic activity between two donors, although the underlying donor-donor variability was not investigated for this report. Additionally, the degree of cytotoxicity was reproducible across the two independent assays performed with NK cells from each donor. The successful use of cryopreserved NK cells in this study provides an additional level of convenience by not requiring effector cells to be isolated and purified on the same day as the assay.
When compared to the standard 51chromium release assay, the option of a stable GFP-labeled NK cell target has several advantages, including the lack of radioactive waste disposal, low background due to minimal spontaneous lysis in the negative controls, and improved assay-to-assay reproducibility. The use of K-562-GFP targets significantly reduces the assay time, in some cases by up to three hours, since there is no need for dye loading and subsequent wash steps (Figure 1). In addition, the stability and homogeneity of the fluorescent signal in the K-562-GFP targets allows a longer time window for sample acquisition and reduces the inter-assay variability that may arise from inconsistent dye loading and dye leakage. While not shown here, this assay is capable of multiplexing with other assays, such as labeling with fluorescent antibodies (eg, CD107a/Lamp-1 as a marker of NK cell activity) or staining with annexin V to detect apoptotic cells.
There are some important points to consider when performing this assay. First, since the measurement of cell populations by flow cytometry is a dynamic process, instrument settings and gates may need to be adjusted from assay to assay. Second, it is critical that the target and effector cells have high viability before performing an assay: if the targets are compromised by poor culture technique, they may show a higher background level of death and increased susceptibility to killing by the effector cells or impaired expression of fluorescent protein leading to a non-homogenous population. Similarly, if effector populations are damaged prior to use, such as by improper thawing technique, they may be functionally impaired, which could impact their cytotoxic activity. Finally, as an alternative to purified NK cells, peripheral blood mononuclear cells (PBMC) (ATCC PCS-800-011) can be used as the effector population with K-562-GFP cells, but this requires a modified gating strategy and typically higher E:T ratios.19
ATCC’s K-562-GFP cell line offers a convenient, reliable, and cost-effective method to study NK cell cytotoxicity. These targets are provided in a near “ready-to-use” state, do not require upstream preparation before combining with effectors, do not exhibit the uneven loading and spontaneous leakage associated with fluorophore/51Cr labeling and give highly reproducible results between assays.
Download a PDF of this application note
Download NowReferences
- Vivier E, et al. Functions of natural killer cells. Nat Immunol, 9(5): 503-510, 2008. PubMed: 18425107
- Pross HF, et al. Spontaneous human lymphocyte-mediated cytotoxicity against tumor target cells. IX. The quantitation of natural killer cell activity. J Clin Immunol 1(1): 51-63, 1981. PubMed: 7334070
- Viel S, et al. Monitoring NK cell activity in patients with hematological malignancies. Oncoimmunol 2(9), e26011, 2013. PubMed: 24327939
- McMichael EL, et al. IL-21 enhances natural killer cell response to cetuximab-coated pancreatic tumor cells. Clin Canc Res 23(2), 489-502, 2017. PubMed: 27435400
- Ilander M, et al. Enlarged memory T-cell pool and enhanced Th1-type responses in chronic myeloid leukemia patients who have successfully discontinued IFN-α monotherapy. PloS One 9(1): e87794, 2014. PubMed: 24498197
- Bohn AB, et al. The effect of IgG levels on the number of natural killer cells and their Fc receptors in chronic inflammatory demyelinating polyradiculoneuropathy. Eur J Neurol 18(6): 919-924, 2011. PubMed: 21219545
- Chien PJ, et al. Inhibition of peripheral blood natural killer cell cytotoxicity in patients with myasthenia gravis treated with plasmapheresis. Eur J Neurol 18(11), 1350-1357, 2011. PubMed: 21554496
- Rosental B, et al. Evaluation of purified natural killer cell functions in familial hemophagocytic lymphohistiocytosis. LymphoSi J 2(4): 207-212, 2015.
- Chernyshov VP, et al. Favorable immune phenotype predicts successful implantation and pregnancy. Immunol Lett 162(2): 217-221, 2014. PubMed: 25445617
- Pham B, et al. Changes in natural killer cell subsets in pediatric liver transplant recipients. Ped Transplant, 16(2): 176-182, 2012. PubMed: 22360401
- Zhao PW, et al. Downregulation and altered function of natural killer cells in hepatitis B virus patients treated with entecavir. Clin Exp Pharmacol Physiol 40(3): 190-196, 2013. PubMed: 23278368
- Brunner KT, et al. Quantitative assay of the lytic action of immune lymphoid cells of 51Cr-labelled allogeneic target cells in vitro; inhibition by isoantibody and by drugs. Immunol 14(2): 181-196, 1968. PubMed: 4966657
- Zaritskaya L, et al. New flow cytometric assays for monitoring cell-mediated cytotoxicity. Exp Rev Vaccines 9(6): 601-616, 2010. PubMed: 20518716
- Wang XM, et al. A new microcellular cytotoxicity test based on calcein AM release. Hum Immunol 37(4): 264-270, 1993. PubMed: 8300411
- Kantakamalakul W, et al. A novel enhanced green fluorescent protein (EGFP)-K562 flow cytometric method for measuring natural killer (NK) cell cytotoxic activity. J Immunol Methods 272(1): 189-197, 2003. PubMed: 12505723
- Poggi A, Zocchi MR. NK cell autoreactivity and autoimmune diseases. In: Evolution of NK-mediated target recognition under the pressure of physiologic or pathologic stimuli 10:169-183, 2015.
- Dahlberg CI, et al. Natural killer cell-based therapies targeting cancer: possible strategies to gain and sustain anti-tumor activity. Front Immunol 6: 605, 2015. PubMed: 26648934
- Allegra S, et al. Implementation of the EGFP-K562 flow cytometric NK test: Determination of NK cytotoxic activity in healthy elderly volunteers before and after feeding. Cytometry A, 69(9): 992-998, 2006. PubMed: 16969797
- Kim GG, et al. A novel multiparametric flow cytometry-based cytotoxicity assay simultaneously immunophenotypes effector cells: comparisons to a 4 h 51Cr-release assay. J Immunol Methods 325(1-2): 51-66, 2007. PubMed: 17617419